
On-chain data shows that HODLing sentiment on the Ethereum network has grown in 2024 while that sentiment on Bitcoin has lost strength.
75% of all Ethereum addresses are long-term holders
In a new one post on X, market intelligence platform IntoTheBlock has talked about how Ethereum and Bitcoin stack up against each other in terms of long-term holders.
the “long-term holder” (LTH) refers to the addresses that have been carrying their coins for more than a year, without involving them in a single transaction.
It is a statistical fact that the longer an investor holds their coins, the less likely they are to sell their coins at any time, so the LTHs, which hold for considerable periods, can be assumed to be quite decisive entities.
Below is the chart shared by IntoTheBlock showing how the percentage of LTHs has changed for Bitcoin and Ethereum over the past year.

Looks like ETH has surpassed BTC in terms of this metric | Source: IntoTheBlock on X
As shown in the graph, Bitcoin began 2024 with a higher percentage of its addresses qualifying as LTH than Ethereum. In the first months of the year, however, a change began to occur as ETH’s HODLer percentage rose while BTC’s went down.
It didn’t take long for the second ranked cryptocurrency in terms of market capitalization to pull ahead of the first ranked in this indicator. Ethereum started the year with less than 60% of its investors falling into the LTH group, but with the growth in HODLing sentiment that has occurred throughout the year, the figure stands at 75% today.
At the same time, Bitcoin’s LTH percentage has been continuously declining, but the magnitude of the decline has not amounted to much. Over 62% of cryptocurrency investors are currently sitting on tokens dormant for more than a year.
Of course, the fact that more investors are becoming diamond hands on the Ethereum network can be positive for the asset’s price, as it indicates that there are fewer holders willing to part with their tokens. Bitcoin’s decline, on the other hand, indicates a weakening of resolve, which could end up bearish.
In some other news, the cryptocurrency market is heading towards the end of 2024 on a cold note when it comes to trading volumeas research firm Santiment pointed out in an X post.
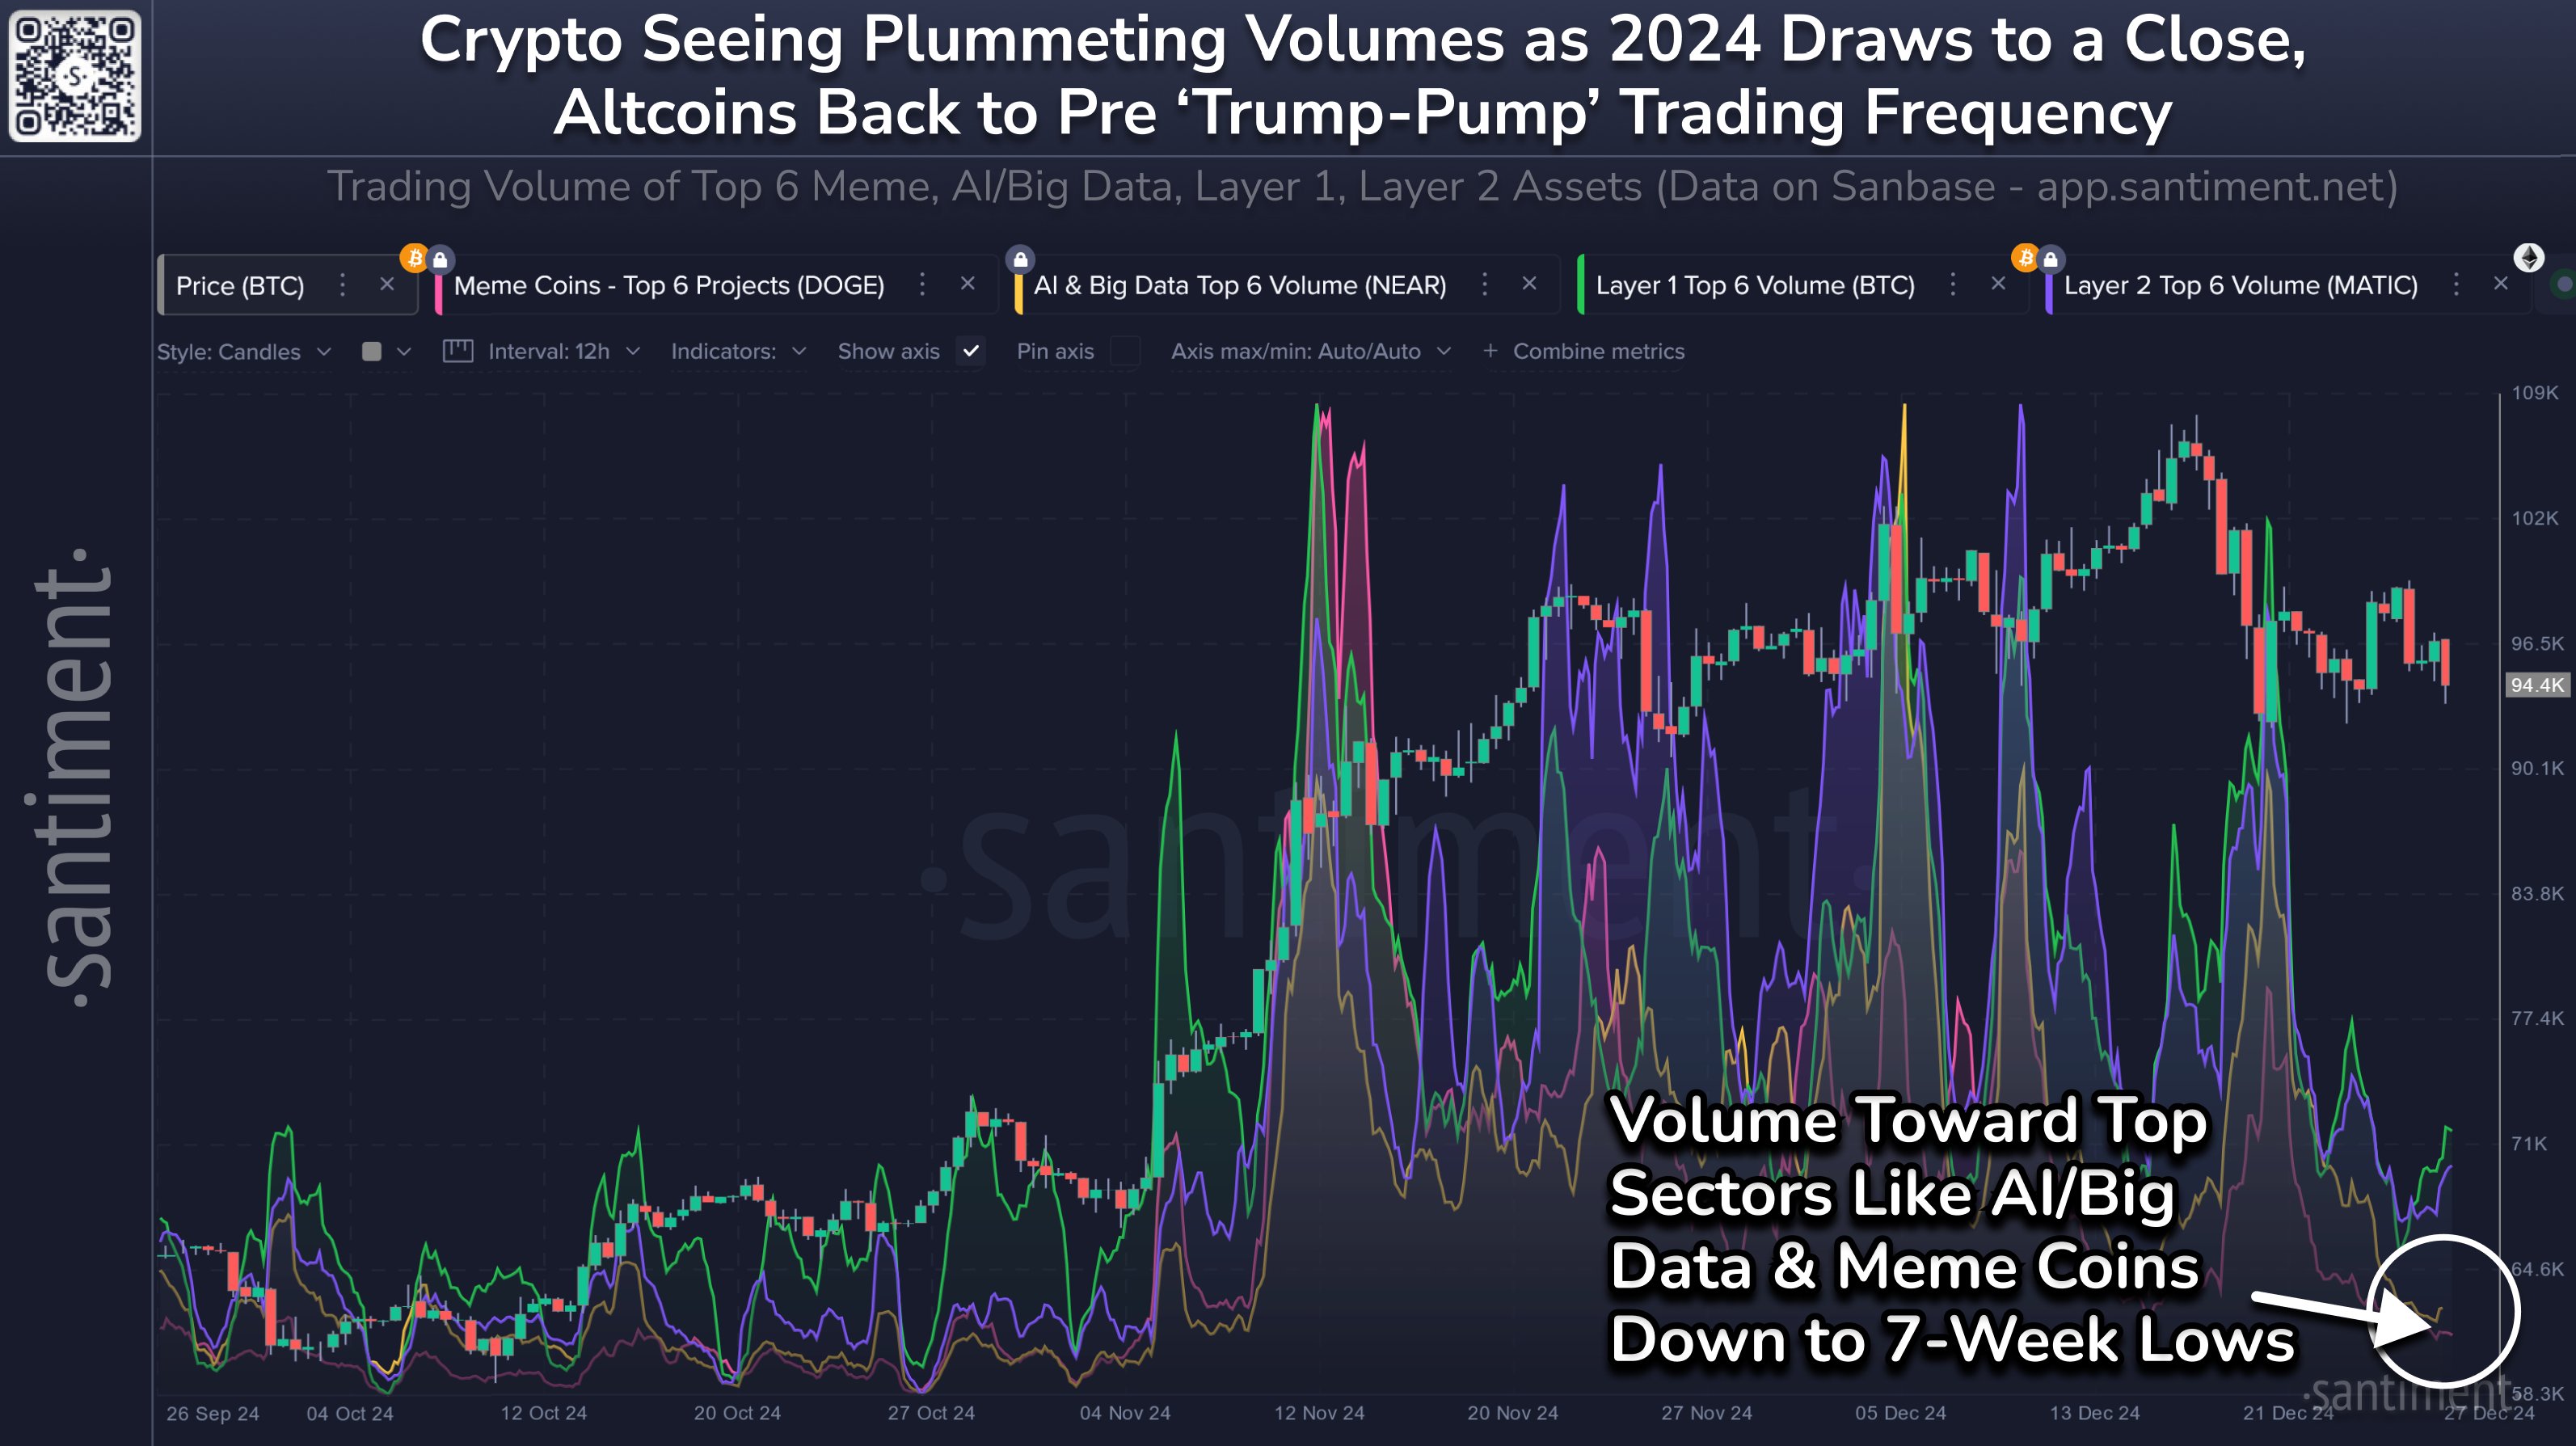
The trend in the trading volume for the various segments of the digital asset sector | Source: Santiment on X
The chart above shows data for the combined trading volume of the various market segments. The It appears that all sides of the market, including majors like Bitcoin and Ethereum, have recently seen a decline in trading activities.
Historically, low interest in the market has generally meant a flat trajectory for the prices of the various coins.
BTC Price
Ethereum has been consolidating sideways since the crash earlier this month, as its price is still trading around $3,350.
The price of the coin seems to have been following a downtrend in recent days | Source: ETHUSDT on TradingView