Ethereum (ETH) has seen a correction of over 10% from the New Year highs amid the market recession, recently dipping below the $3,300 support. Despite the ongoing pullback, some analysts remain optimistic about ETH’s Q1 performance, suggesting new highs are around the corner.
Ethereum forms bullish pattern
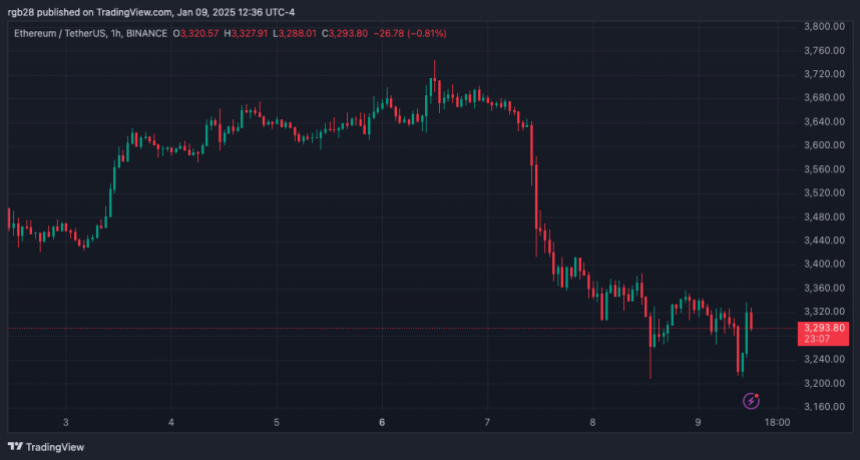
Ethereum shredded its New Year’s gains today after falling below the $3,320 mark. Following the market recession, the second-largest cryptocurrency by market capitalization saw a 14% drop from Monday’s high of $3,744 to below the $3,300 support.
During the year-start rally, ETH’s price recovered 20% from correction lows, rising to pre-recovery levels for the first time in nearly three weeks. The market pullback, which saw Bitcoin fall 7.2% in 24 hours, sent Ethereum to the $3,210 level on Thursday morning. The $3,200-$3,300 price range served as a key support zone for ETH throughout December.
Following its recent performance, several analysts have suggested that the cryptocurrency is forming an important reversal pattern, which could send ETH’s price to new highs. On Wednesday, cryptoanalyst Rekt Capital noted that Ethereum is forming a multi-month inverse Head and Shoulders pattern within the 1M time frame.
For the analyst, it is “clear” that the $3,650-$3,760 area is “a key region of resistance, developing just below $4,000, with price forming that resistance at a lower height that could act as a neckline to the pattern.”
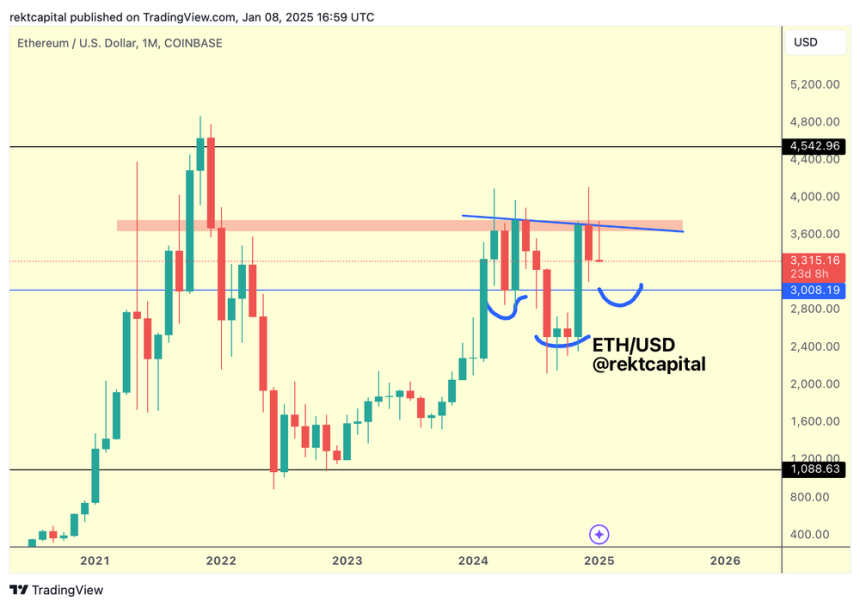
He noted that “its endpoint is at the psychological level of $3,000,” adding that “any pullback near the $3,000 level could cause Ethereum to develop a right shoulder.”
Likewise, when Ethereum dropped to the low of the $3,200 range, Miky Bull marked the same pattern, suggesting that the $7,000 target is “hardening”. According to the chart, ETH’s price could see an increase of 87.53% near the $7,400-$7,500 price range, based on the bullish setup.
No More “Major Retraces” for ETH?
Cryptanalyst Ali Martinez too shared his take on the bullish pattern, claiming a drop to $2,900 “will be very bullish” for ETH. The analyst claimed that would create “an excellent opportunity to buy $7,000 next time!”
However, it is worth noting that the bullish pattern would be invalidated in the case of Ethereum falls below $2,800, where the left shoulder formed.
Meanwhile, another market watcher shared the similarities between ETH’s performance in early 2024 and 2025, showing the King of Altcoins falling below its yearly opening in January 2024 before climbing higher next month.
He said: “I think it’s really important not to confuse a few days of red price action with high timeframe bias. I strongly believe this is an annual open shakeout after some overeager participants lifted too big, too soon. I’m very bullish on H1 2025.”
Analyst Crypto Wolf consider there is likely to be “little or no downside left”, suggesting that ETH could track another 4% to 7% maximum before targeting all-time high (ATH) levels.
At the time of writing, ETH is trading at $3,255, down 2.15% on the daily time frame.
Featured image from Unsplash.com, chart from TradingView.com