TLDR
- Ethereum has shown strong upward momentum, breaking above $3,750 and peaking at $3,988
- A bullish trend line is forming with support at $3,840, indicating continued upside potential
- The next major resistance levels are $3,980 and $4,000, with potential targets at $4,150 and $4,320
- Technical indicators including MACD and RSI are showing bullish momentum
- Key support levels are at $3,840, $3,750 and $3,665 if price pulls back
Ethereum’s price movement has caught the market’s attention as it steadily approaches $4,000, showing strength in recent trading sessions. The second largest cryptocurrency by market capitalization has established multiple support levels above $3,800, indicating a solid foundation for potential further gains.
Over the past few hours, Ethereum successfully broke above the $3,750 resistance level and continued its upward trajectory to reach a local high of $3,988. This move represents a clear break above several technical resistance levels that had previously limited price action.
The price action is showing particular strength above the $3,800 level, where traders have established a notable support zone. Technical analysis reveals a bullish trend line forming with support at $3,840, providing a base for potential future moves higher.
Trade data indicates that Ethereum’The price is currently above both the $3,800 mark and the 100-hour Simple Moving Average, technical indicators that traders often use to gauge market momentum. This positioning suggests underlying strength in the current market structure.
Market participants have noted several key resistance levels that could influence future price action. The first major obstacle appears at $3,950, followed by a more extensive resistance zone near $3,980. Breaking above these levels could open the way to test the psychologically important $4,000 mark.
Should buyers succeed in pushing the price above $4,000, technical analysis suggests potential targets of $4,150 and $4,320. These levels represent the next major resistance zones where increased selling pressure may occur.

However, traders should note the presence of several support levels that may come into play if price experiences a retracement. The first notable support is at $3,840, coinciding with the bullish trend line identified in the recent price action.
Below this, the $3,750 zone represents another crucial support level, corresponding to the 50% Fibonacci retracement level of the recent rally from $3,527 to $3,988. This technical indicator often serves as a reference point for traders analyzing potential reversal levels.
Technical indicators currently support the bullish case, with the MACD showing increasing momentum in the positive zone. The Relative Strength Index (RSI) remains above the 50 mark, indicating strong buying pressure in the market.
Analysis of trading volumes shows steady participation from market participants, indicating genuine interest in the current price action rather than artificial movement. This volume profile lends credence to recent price increases.
The hourly chart reveals a pattern of higher lows, which is usually considered a bullish market characteristic. This pattern has remained intact during the recent price action, providing further technical support for the uptrend.
If the price fails to maintain its current trajectory, several additional support levels may enter. These include the $3,665 zone and, in a more extensive pullback scenario, the $3,550 area. The $3,500 level represents a key support zone that traders are watching closely.
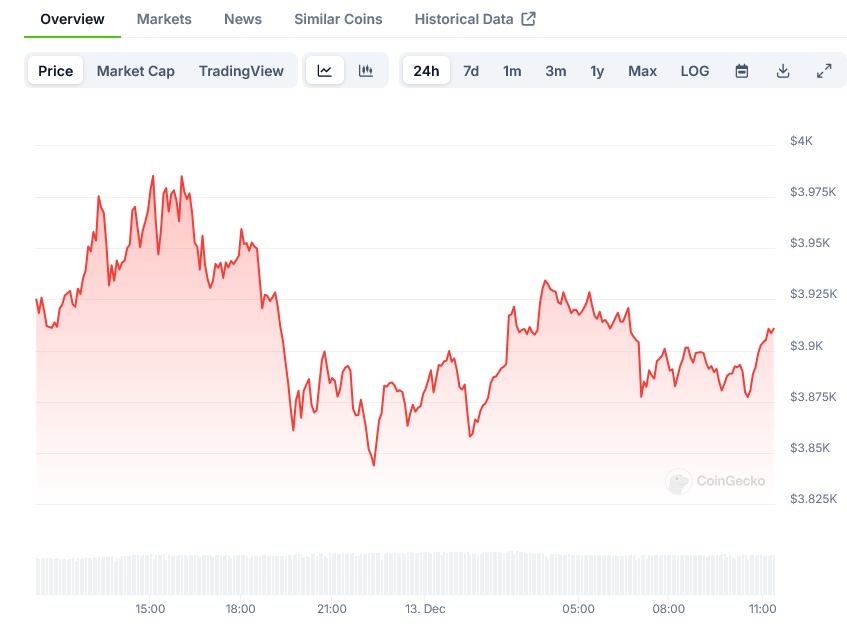
Recent price data shows consolidation near the $3,900 level, with traders apparently gathering strength for potential attempts at higher levels. The market has shown an ability to hold profits, indicating underlying buying pressure.
The current market structure includes multiple levels of support, providing potential safety nets for any short-term price corrections. These technical factors contribute to the overall stability of the recent price rally.
Recent price action sees Ethereum trading near $3,900, maintaining its position above key support levels as market participants assess the potential for further upside.