After weeks of consolidation, Ethereum (ETH) appears to be moving upwards from its $3,200 to $3,500 trading range. Bullish technical indicators on the ETH chart, along with strengthening fundamentals, suggest significant upside potential for the second-largest cryptocurrency by market capitalization.
Is Ethereum Targeting $4,000?
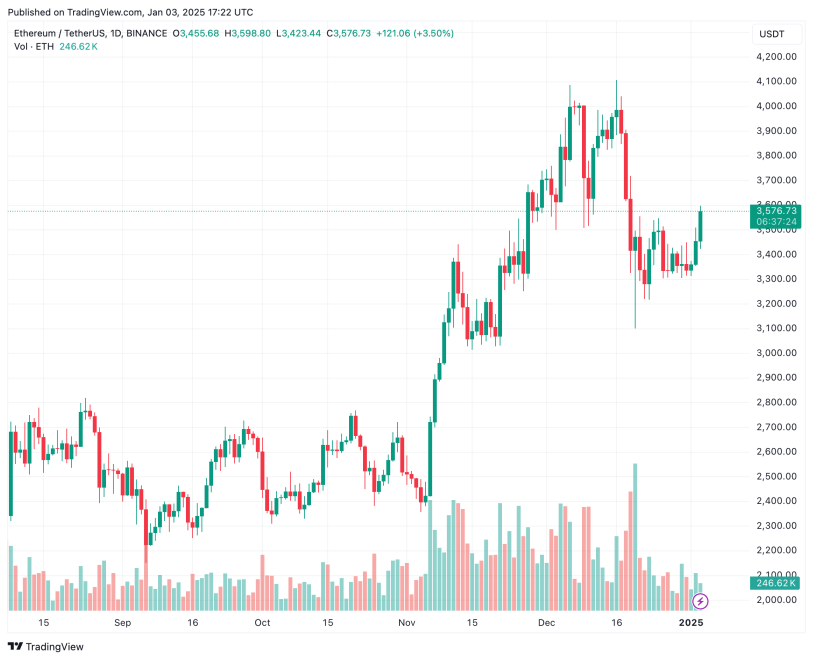
Last month, Ethereum tried to break the critical resistance level of $4,000 twice but failed on both occasions. Between December 16th and December 19th, ETH experienced a steep decline, falling from $4,000 to as low as $3,100 – a drop of more than 20% in three days.
Since December 19, ETH has remained range-bound, fluctuating between $3,200 and $3,500, raising concerns about a potential decline below the $3,000 level. However, ETH is showing signs of resurgence today, breaking out of a symmetrical triangle pattern, with $4,000 as the first major resistance level to overcome.
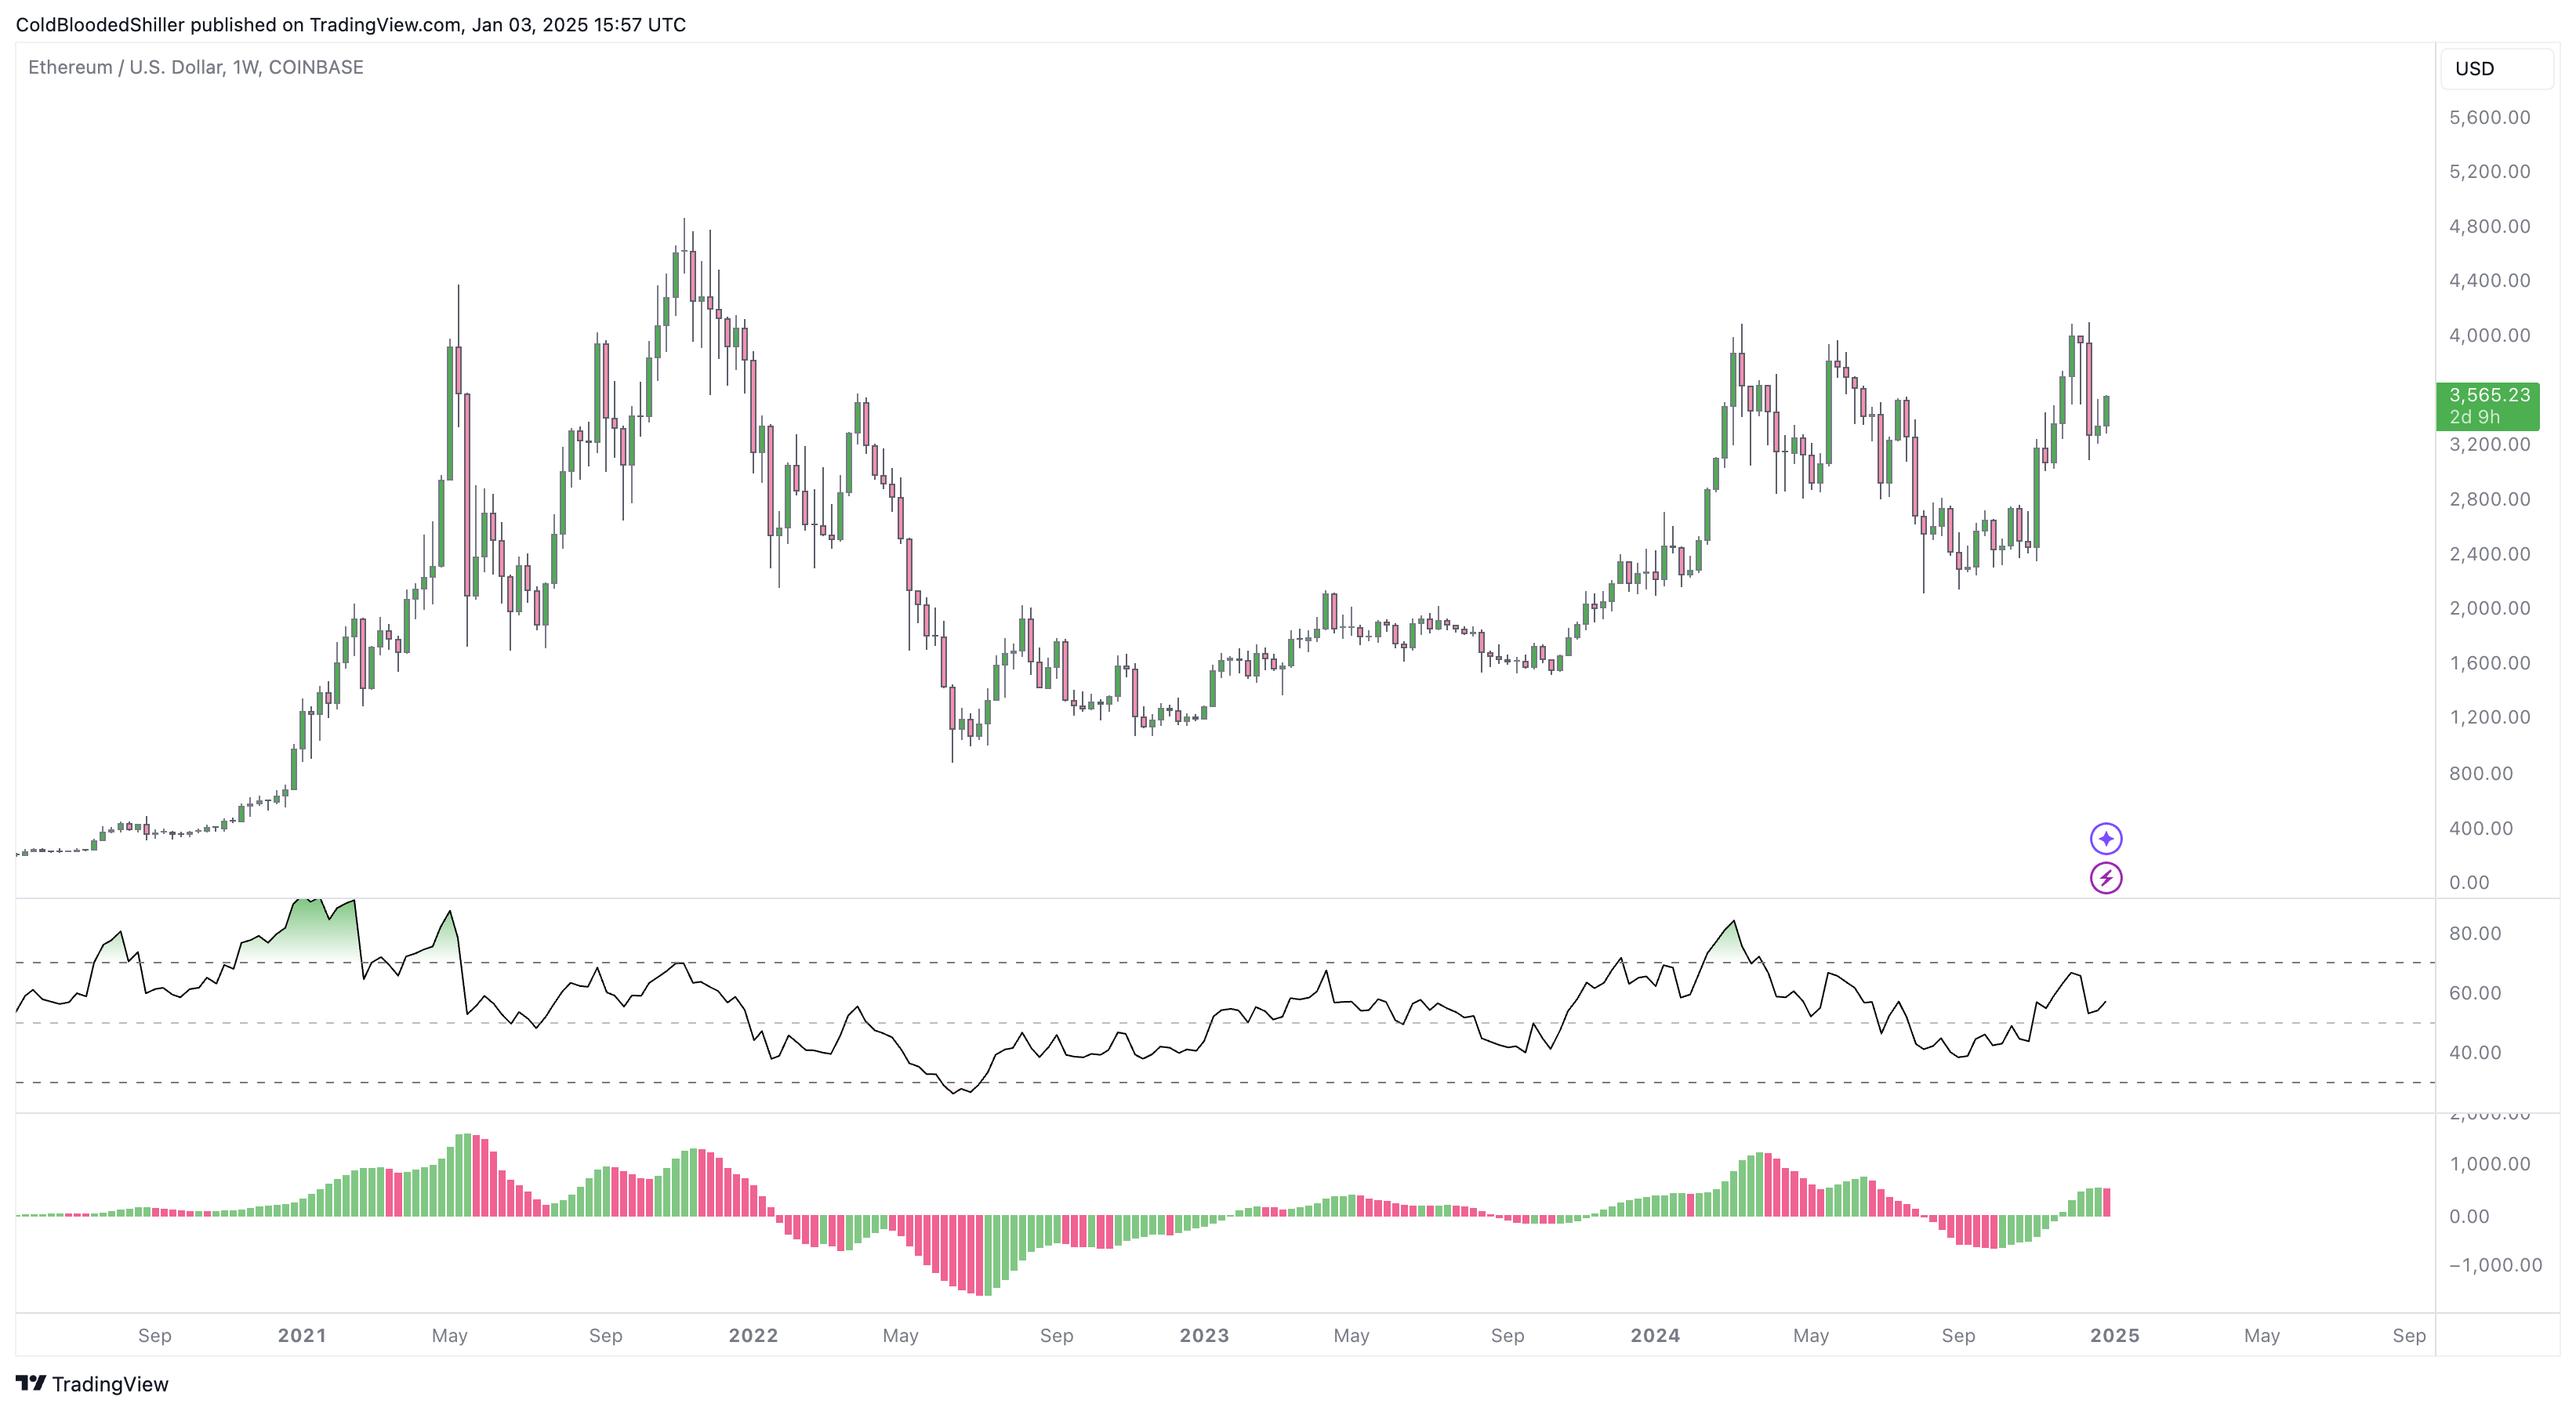
Crypto trader and analyst Cold Blooded Shiller noted that Ethereum’s weekly Relative Strength Index (RSI) has recovered, which could provide the momentum needed to push ETH above $4,000. The analyst added that if ETH breaks above $3,500, they plan to increase their spot holdings.

For the uninitiated, a weekly RSI reset occurs when the RSI, a momentum indicator, moves back from overbought or oversold levels towards its neutral zone, usually indicating that a potential trend reversal or consolidation is underway. In Ethereum’s context, this reset could signal reduced selling pressure and an opportunity for a recovery.
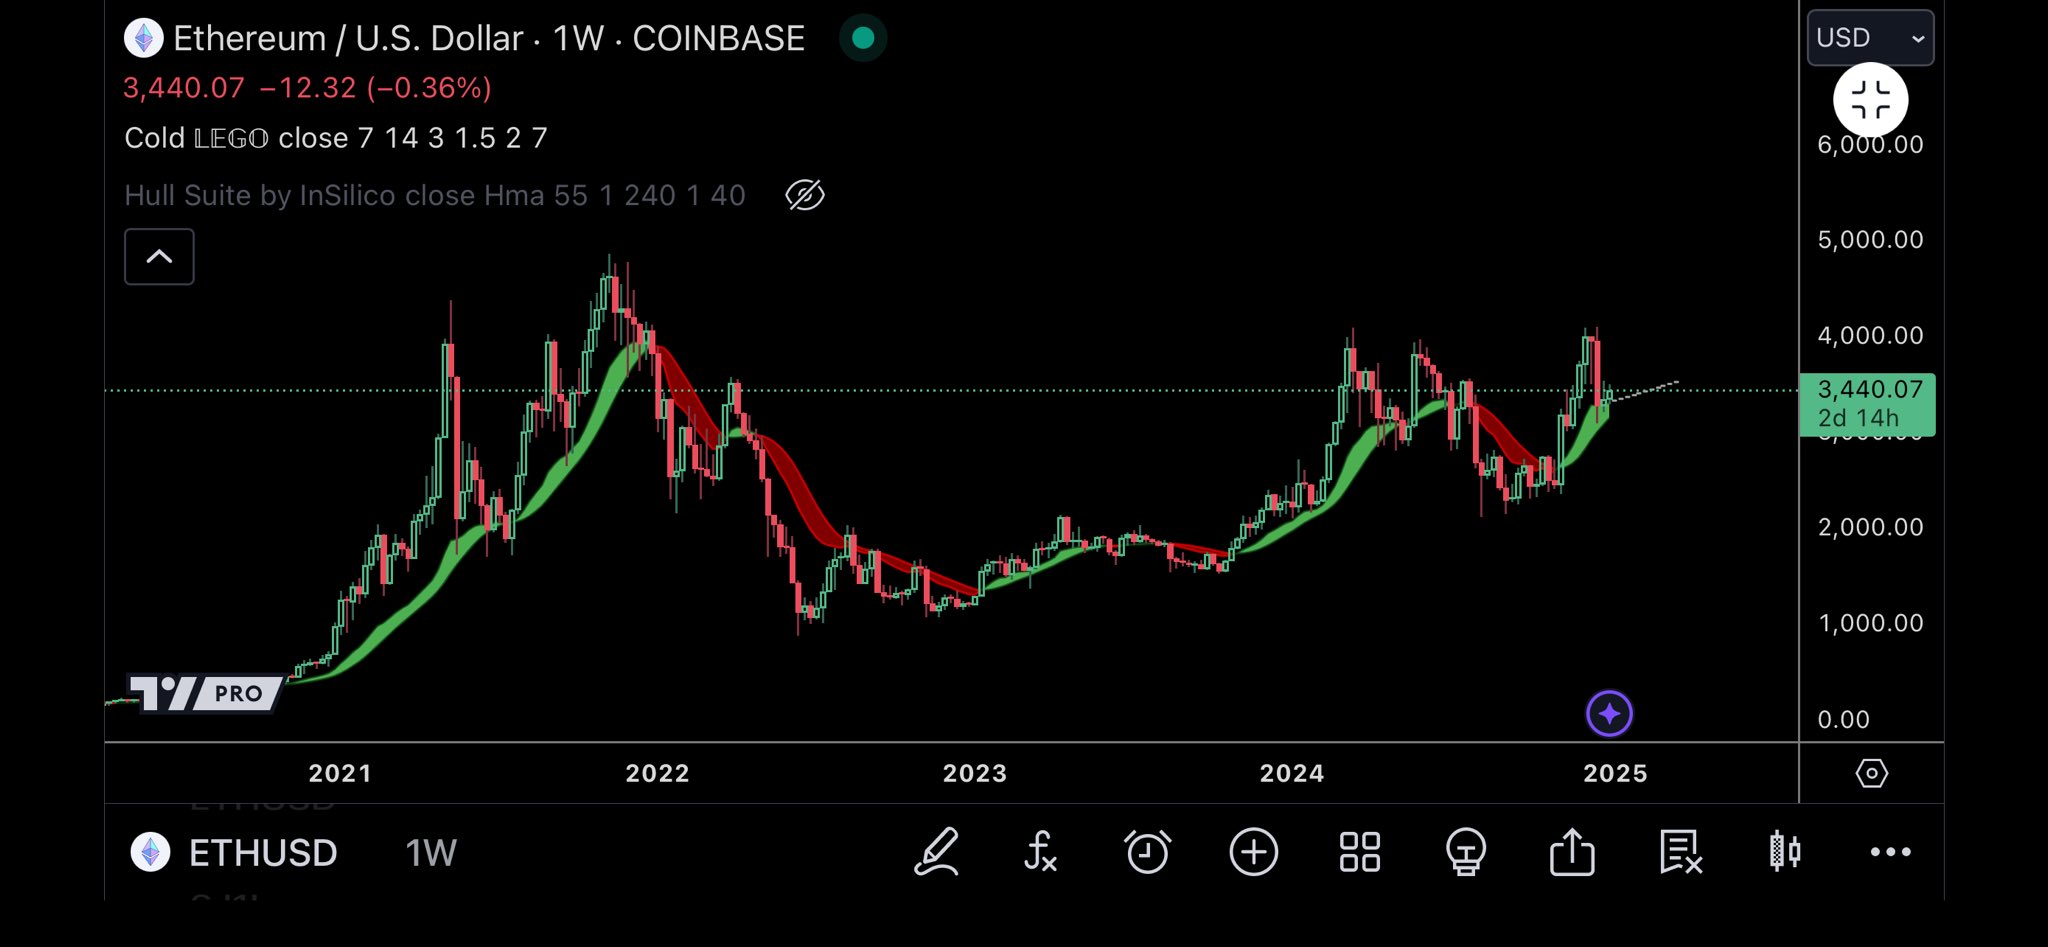
Seasoned crypto trader TraderSZ echoed similar sentiments. In a post on X, the analyst shared weekly and monthly Ethereum charts, suggesting an upside breakout may be imminent.
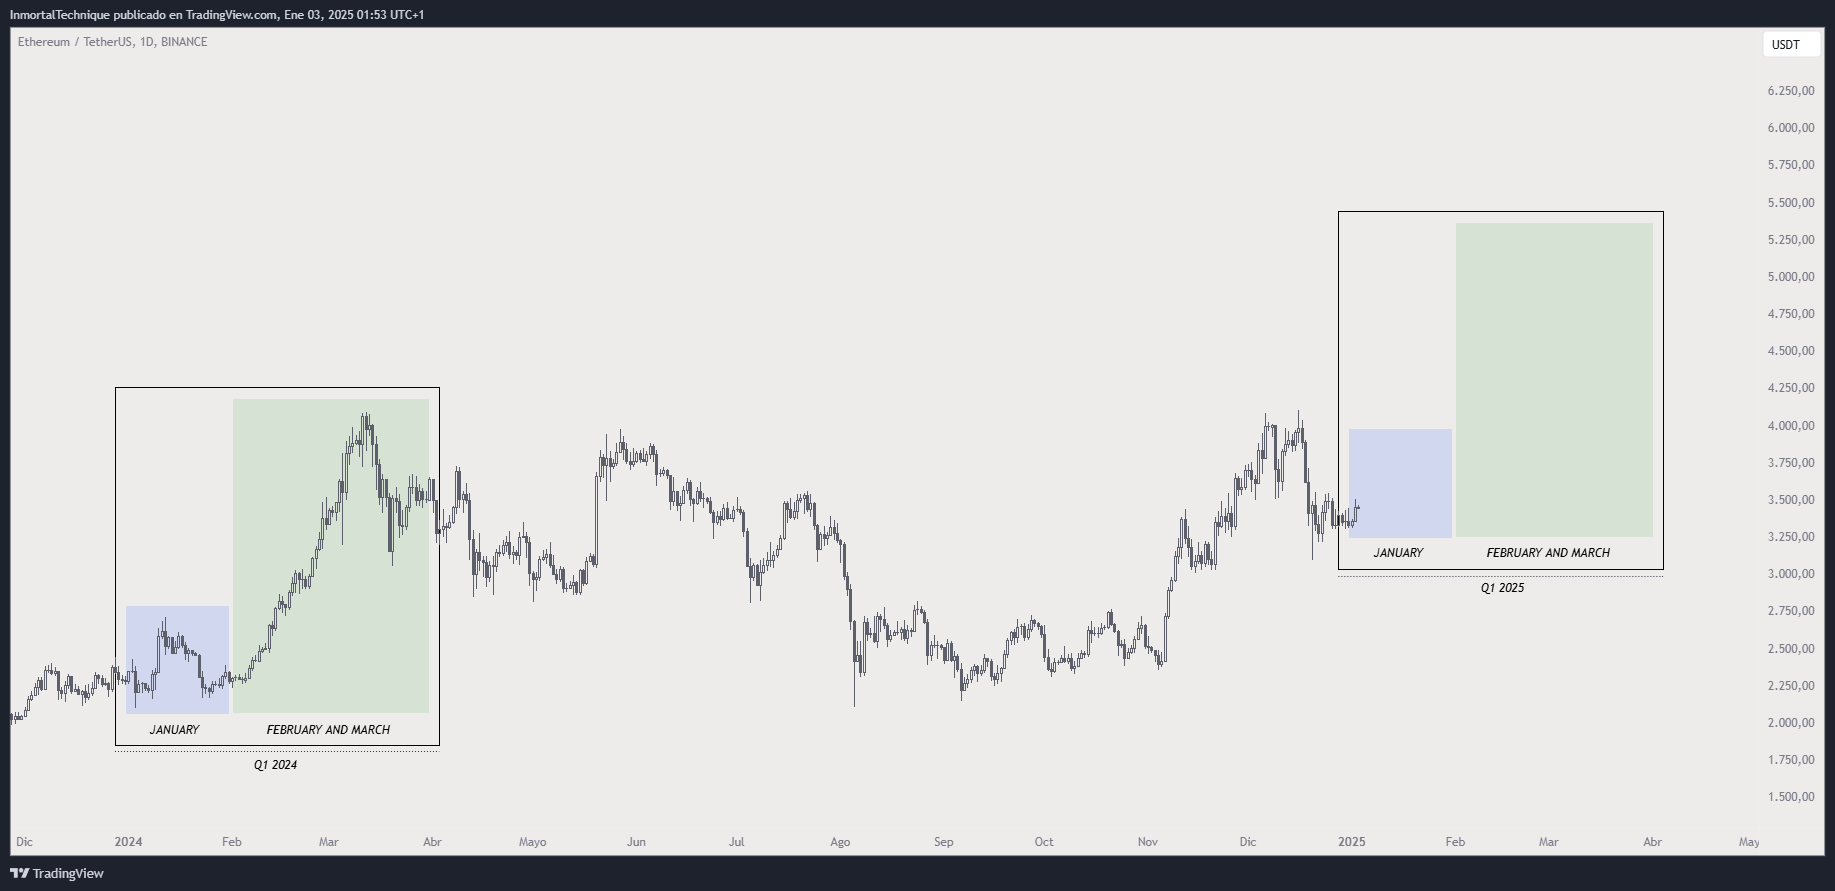
Another prominent cryptocurrency analyst known as Inmortal weighed in on Ethereum’s potential price trajectory. In its analysis, Inmortal compared the current ETH price action with Q1 2024, highlighting similarities between the two periods.
According to the following chart, January often acts as an accumulation phase, while February and March tend to experience parabolic price movements. If ETH follows a similar pattern in 2025, it could aim for $5,300.
Will Ethereum’s Rise Trigger an Alt Season?
While Bitcoin (BTC) witnessed unprecedented price gains in 2024 – briefly touching six-figure territory – Ethereum has yet to experience comparable explosive growth. ETH’s current all-time high (ATH) dates back to November 2021, underlining that ETH has lagged behind BTC during this cycle.
However, recent market trends indicate that ETH can finally gaining ground against BTC as evidenced by the steadily increasing ETH/BTC ratio. Additionally, Bitcoin dominance is shown ready for a decline after forming a lower top on the weekly chart.
This change could pave the way for the long-awaited alt season, giving a boost to ETH and other altcoins. At press time, ETH is trading at $3,576, up 3.2% over the past 24 hours.